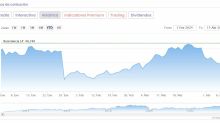
NYSE - Nasdaq Real Time Price USD

Morgan Stanley (MS)

Comparar
119,30 +0,17 (+0,14%)
Al cierre: 16:01 GMT-4
119,38 +0,08 (+0,07%)
Cotización tras cierre: 18:13 GMT-4
Loading Chart for MS
DELL
  • Cierre anterior 119,13
  • Abrir 118,89
  • Oferta 119,32 x 800
  • Precio de compra 119,37 x 800
  • Rango diario 118,83 - 120,09
  • Intervalo de 52 semanas 70,27 - 121,45
  • Volumen 4.621.572
  • Prom. volumen 5.846.696
  • Capitalización de mercado (intradía) 192,312MM
  • Beta (5 años al mes) 1,36
  • Ratio precio/beneficio (TMTM) 18,13
  • BPA (TTM): 6,58
  • Fecha de beneficios 16 ene 2025
  • Previsión de rentabilidad y dividendo 3,70 (3,11%)
  • Fecha de exdividendo 31 oct 2024
  • Objetivo est 1a 115,96

Morgan Stanley, a financial holding company, provides various financial products and services to corporations, governments, financial institutions, and individuals in the Americas, Europe, the Middle East, Africa, and Asia. It operates through Institutional Securities, Wealth Management, and Investment Management segments. The Institutional Securities segment offers capital raising and financial advisory services, including services related to the underwriting of debt, equity, and other securities, as well as advice on mergers and acquisitions, restructurings, real estate, and project finance. This segment also provides equity and fixed income products comprising sales, financing, prime brokerage, and market-making services; foreign exchange and commodities; corporate and commercial real estate loans, commercial mortgage and secured lending facilities, and financing for sales and trading customers, and asset-backed and mortgage lending; and wealth management services, investment, and research services. The Wealth Management segment offers financial advisor-led brokerage, custody, administrative, and investment advisory services; self-directed brokerage services; financial and wealth planning services; workplace services, including stock plan administration; annuity and insurance products; securities-based lending, residential real estate loans, and other lending products; banking; and retirement plan services to individual investors and small to medium-sized businesses and institutions. The Investment Management segment provides equity, fixed income, alternatives and solutions, and liquidity and overlay services to benefit/defined contribution plans, foundations, endowments, government entities, sovereign wealth funds, insurance companies, third-party fund sponsors, corporations, and individuals through institutional and intermediary channels. The company was founded in 1924 and is headquartered in New York, New York.

www.morganstanley.com

80.205

Empleados a tiempo completo

31 de diciembre

Año fiscal finalizado

Financial Services

Sector

Capital Markets

Sector

Noticias recientes: MS

Ver más

Descripción general del rendimiento: MS

Rentabilidad total acumulada hasta el 29/10/2024, que puede incluir dividendos u otras distribuciones. El valor de referencia es

.

Rentabilidad hasta la fecha

MS
31,56 %
S&P 500
22,29 %

Rendimiento en 1 año(s)

MS
76,38 %
S&P 500
41,67 %

Rendimiento en 3 año(s)

MS
28,70 %
S&P 500
26,90 %

Rendimiento en 5 año(s)

MS
199,25 %
S&P 500
91,91 %

Comparar con: MS

Selecciona hasta 4 acciones para analizar empresas similares utilizando métricas clave de rendimiento.

Estadísticas: MS

Ver más

Medidas de valoración

A partir del 28/10/2024
  • Capitalización de mercado

    192.04B

  • Valor de empresa

    --

  • P/E últimos 12 meses

    18.10

  • Precio/beneficio anticipado

    15.17

  • Ratio precio-expectativas de beneficio (5 años previstos)

    3.45

  • Precio/ventas (ttm)

    3.52

  • Precio/valor (tmr)

    2.09

  • Valor/Ingresos de la empresa

    4.61

  • Valor/EBITDA de empresa

    --

Destacados financieros

Rentabilidad y estado de resultados

  • Margen de beneficios

    19,20%

  • Rentabilidad económica (ttm)

    --

  • Rentabilidad financiera (ttm)

    --

  • Ingresos (ttm)

    58,28MM

  • Ingresos netos disponibles (ttm)

    10,62MM

  • BPA diluido (ttm)

    6,58

Hoja de balance y flujo de caja

  • Efectivo total (tmr)

    528,66MM

  • Endeudamiento/Patrimonio total (tmr)

    401,01%

  • Flujo de efectivo apalancado (ttm)

    --

Análisis de investigación: MS

Ver más

Beneficios por acción

Consensus EPS
 

Ingresos vs. Beneficios

Ingresos 15,3MM
Beneficios 3,19MM
 

Recomendaciones de analistas

  • Compra agresiva
  • Comprar
  • Mantener
  • Peor que el mercado
  • Venta
 

Objetivos de precio de analista

93,32 Mín.
115,96 Media
119,30 Actual
135,00 Máx.
 

Los demás también ven